Monitoring Docker Thin Pool Usage with Prometheus
Update (12/4/20): I highly recommend using the latest Amazon ECS-optimized Amazon Linux 2 AMI. It uses Docker’s OverlayFS (overlay2) storage driver. The same partition is used for OS, Docker images and metadata. It’s easier to monitor filesystem usage using the Prometheus Node exporter. If you still have to use the older ECS AMI v2015.09.d or later, this article might be useful for you.
There are plenty of tools out there for monitoring Docker using Prometheus. We can use the Node Exporter to gather useful information for Docker hosts at an OS/kernel level (memory, cpu, network, filesystem) and at a container level there is cAdvisor which reports resource usage and performance data. Unfortunately I couldn’t find any way of monitoring Docker Thin Pool usage with Prometheus so I wrote a quick Python script to generate usage metrics that are exposed using Node Exporter’s textfile collector. So first, what does “Thin Pool” in Docker means? The Docker documentation is not very clear on this and this answer on Stackoverflow makes it easier to understand:
“A thin pool is a storage source that provides on-demand allocation for storage space. It is more or less similar to virtual memory, which provides full address space to every process. Thin pool is a conceptional term which stands for the backing storage source used by thin provisioning. Thin provisioning allocates virtual chunks of storage from thin pool, while fat provisioning allocates physical blocks of storage from the traditional storage pool. The Docker Engine can be configured to use Device Mapper as its storage driver. This is where you deal with thin provisioning. According to Docker’s documentation, production hosts using the devicemapper storage driver must use direct-lvm mode. This mode uses block devices to create the thin pool.”
If you use AWS ECS, this is done by attaching a specific EBS volume to an instance (/dev/xvdcz). The volume is configured as a Logical Volume Management (LVM) device and it is accessed directly by Docker via the devicemapper backend. If you do a “df -h” on your ECS instance, you will be unable to see it mounted and you can’t monitor its usage using the Node Exporter. But you can see it using the command “docker info |grep Space”. At Signal, we ran into an issue where we were unable to launch tasks on a few instances because we didn’t have enough space left on the Thin Pool. When this happens, the ECS Task event log will throw an error similar to this:
CannotCreateContainerError: API error (500): devmapper: Thin Pool has 4350 free data blocks which is less than minimum
required 4454 free data blocks. Create more free space in thin pool or use dm.min_free_space option to change behavior
After increasing the size of our Thin Pool we needed a good way to monitor it so we don’t run into the same issue again. Since we’re running on the Node Exporter on each ECS instance using /tmp as a textfile collector entrypoint, it’s just a matter of calling “docker space”, collect information and write a text file into /tmp so it will be scraped as any other node metric. We run it from cron every minute:
There are 3 metrics:
docker_thinpool_data_space_total_bytes
docker_thinpool_data_space_used_bytes
docker_thinpool_minimum_free_space_bytes
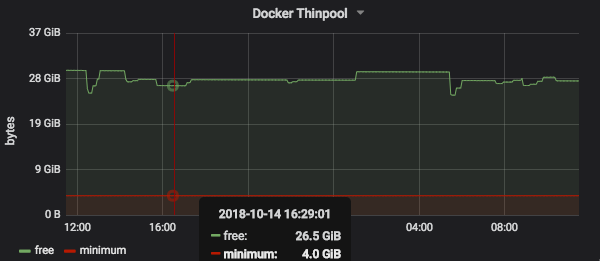
I think these are self-explanatory and mimic what we see from “docker info”. A quick way of showing how much free space you have left on a Grafana Dashboard would be something like:
docker_thinpool_data_space_total_bytes - docker_thinpool_data_space_used_bytes
You could also build a Prometheus alert using the following expression:
expr: (docker_thinpool_data_space_total_bytes - docker_thinpool_data_space_used_bytes) < docker_thinpool_minimum_free_space_bytes
I don’t monitor any metadata space usage as it’s not much of a problem for us but it’s very easy to add them to
prom-docker-thinpool-usage.py. This could be useful for others.